Table of Contents
Creating spatially enabled and interactive web applications, either with applications like ESRI’s Web App Builder or with a custom open-source stack is said by many to be the future of the GIS and mapping trade. In many cases it requires skills such as the linux command line, web design and software version control that may or may not be taught in your average GIS program.
This tutorial will showcase the creation of both the back and front end of a real-time web application that will display geo-tagged tweets and pictures from Twitter. The finished product will have:
- A map that displays the location of real-time incoming tweets and pictures
- Selectable heatmap or chloropleth overlays.
- Summary statistics for pre-defined areas (city wards, for example)
- Tools to allow users to query summary stastics for arbitrary areas
Don’t be fooled, this is going to be quite the endeavor! I will go over the methodology for processing the incoming data and the limitations of our analysis in part 3 of this series, but the end result will be a single page web application that allows users to view both current and historical tweet activity in both space and time.
In order to get the most out of this tutorial you should know or have knowledge of Python, HTML, CSS, JavaScript, and the linux command line. Knowledge of git would be an asset as well. I will try and provide as many resources from other sites for people to learn as they go.
The Stack
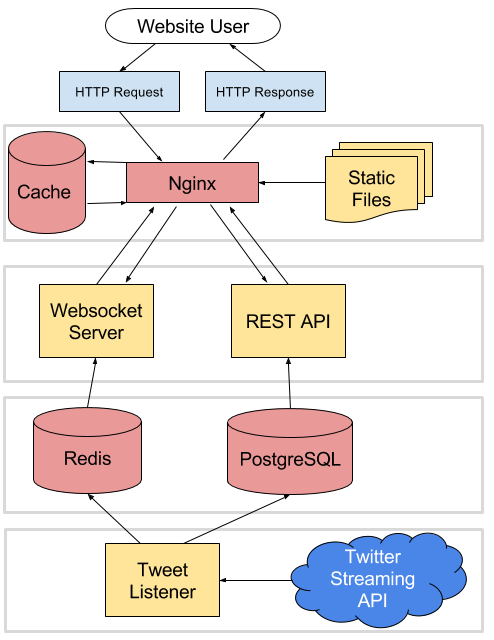 A diagram showing how a request from the front end will be processed.
Starting from the bottom on up I’ll give a short overview of the tech stack that I’ve chosen for this project.
Tweet Listener
The tweet listener, written in Python, will connect and listen to the Twitter Streaming API. When tweets are received, we’ll write code to filter out ones we want and both insert them into our database via the GeoAlchemy ORM, and publish them to our websocket server.
Redis/PostgreSQL
We’ll be utilizing two different storage engines for the project - Redis and PostgreSQL. Redis will be used as a medium to transmit messages between the tweet listener and websocket clients, while PostgreSQL will be the relational and geospatial database engine that we’ll use for our analysis.
Websocket Server
We’ll use a custom Python script to connect to Redis, subscribe to incoming messages, and serve the response via websocketd.
REST API
The Flask microframework will be used to handle incoming requests, query the database, and return JSON to be ingested by the front end.
Nginx
We’ll be using Nginx as our reverse proxy. When users send a request to our website Nginx will decide whether or not to serve the response from a cache, our static files, or whether to pass the request to our websocket server or API endpoints.
Tutorial Series Breakdown
This series will be broken down into a few different parts.
- Environment setup
- Connecting to Twitter and inserting data into the database
- Pushing real-time data to websocket clients
- Display live data in a web map
- Define/implement the REST API
- Displaying graphs and heatmaps
- Optimization and security considerations
- Performing analysis in QGIS